


 6 Layers of Protection


We are pleased to present our new investigation and monitoring solution - Dashboard PRO. It is a set of customizable visual representations that reflects the data in your environment, allows you to analyze it and provides quick access to full details on any piece of information.
Imunify360 processes a vast data pool to deliver the highest-quality security solution. Dashboard PRO taps into this data pool and brings it to the surface so you can see information about servers, IP addresses, attacks, users, events, incidents and so much more. We created a set of highly useful visuals - graphs and tables for your convenience.
However, Dashboard PRO is a fully customizable solution. The user can create their own Queries and Dashboards to export, reflect, compare or investigate any bit of information stored in the database. To create custom queries you simply need to operate SQL and make use of many advantageous functions of the Redash.
We created Dashboard PRO to give users like you a deeper understanding of the security status of your server fleet. Dashboard PRO helps you see security gaps and areas for improvement. And it will allow security teams to closely monitor the environment while providing support teams with an unparalleled way to make high-quality incident investigations of any security case.
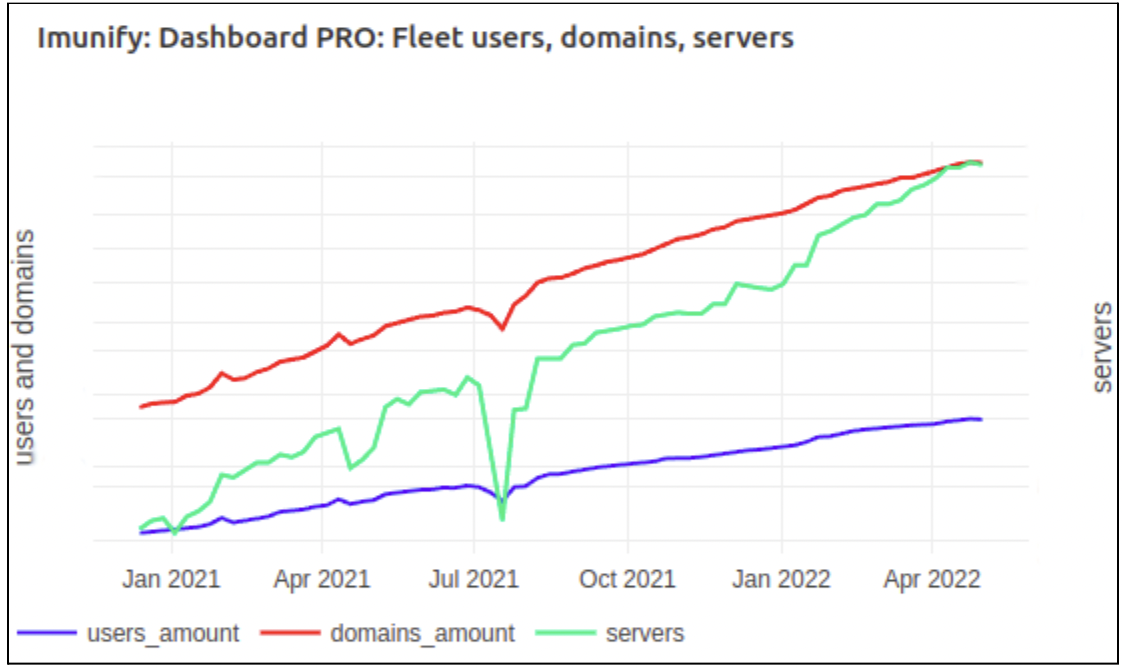
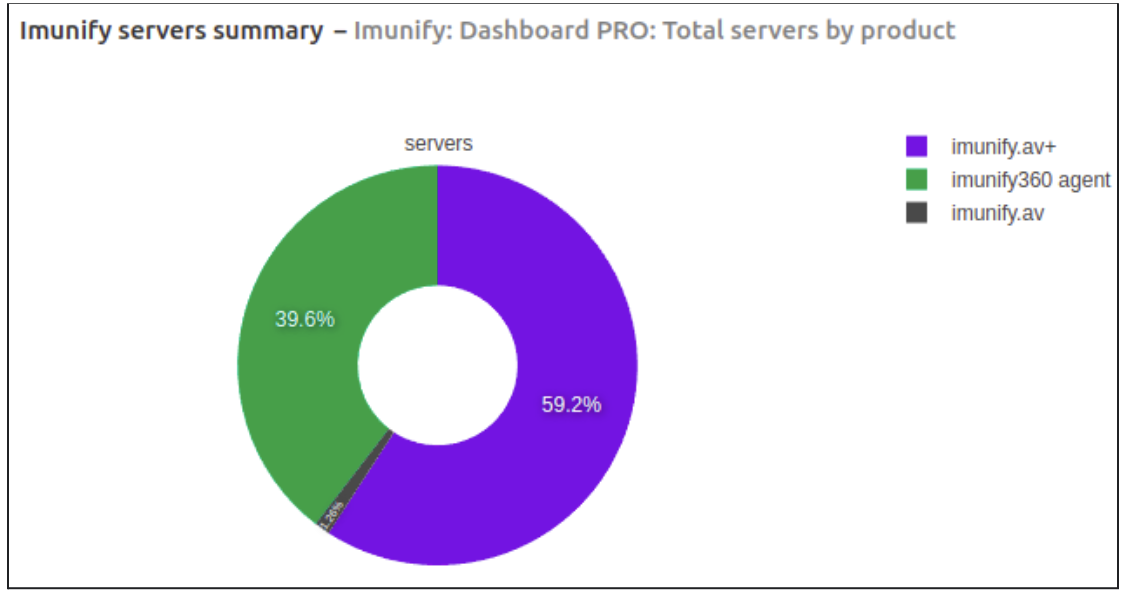
We prepared a sample dashboard with some general information listed on the top. Such as the number of users, domains, servers and servers breakdown by the product installed.
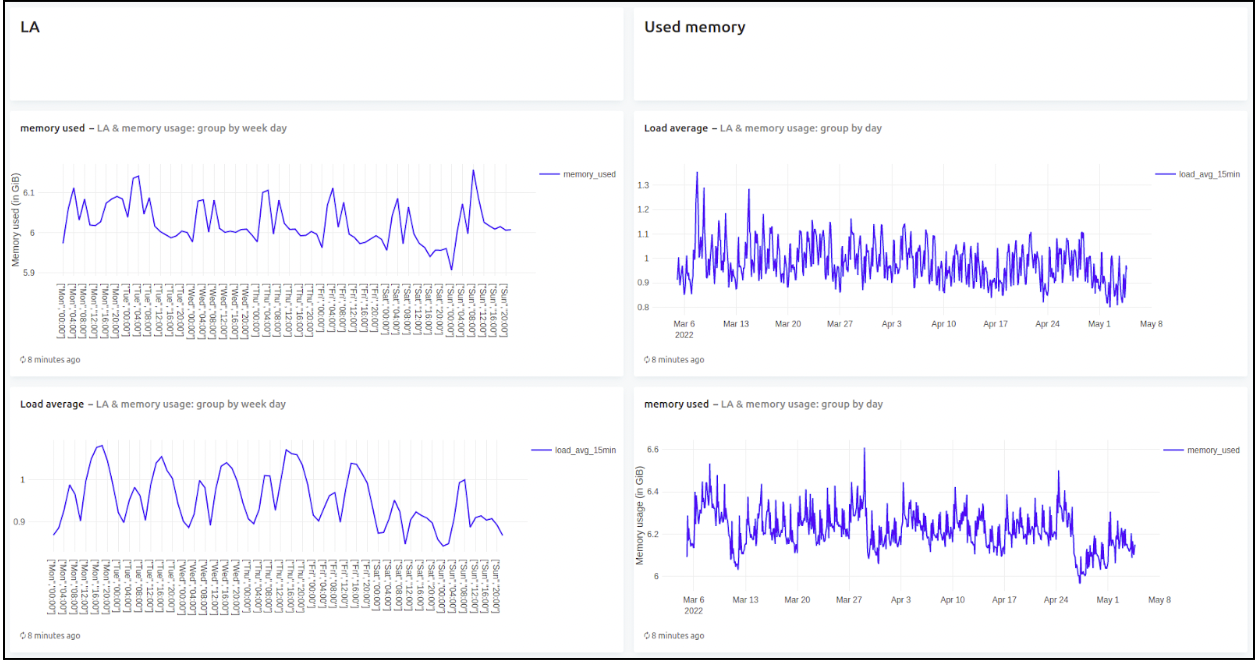
Also, we prepared a few charts for the performance overview of the server fleet. Load average and memory usage charts are available.
The ratio of recommended security settings and current settings on the servers are presented by the set of pie charts. You can dive into details and get to know what exact server and what exact setting strays from the recommended.
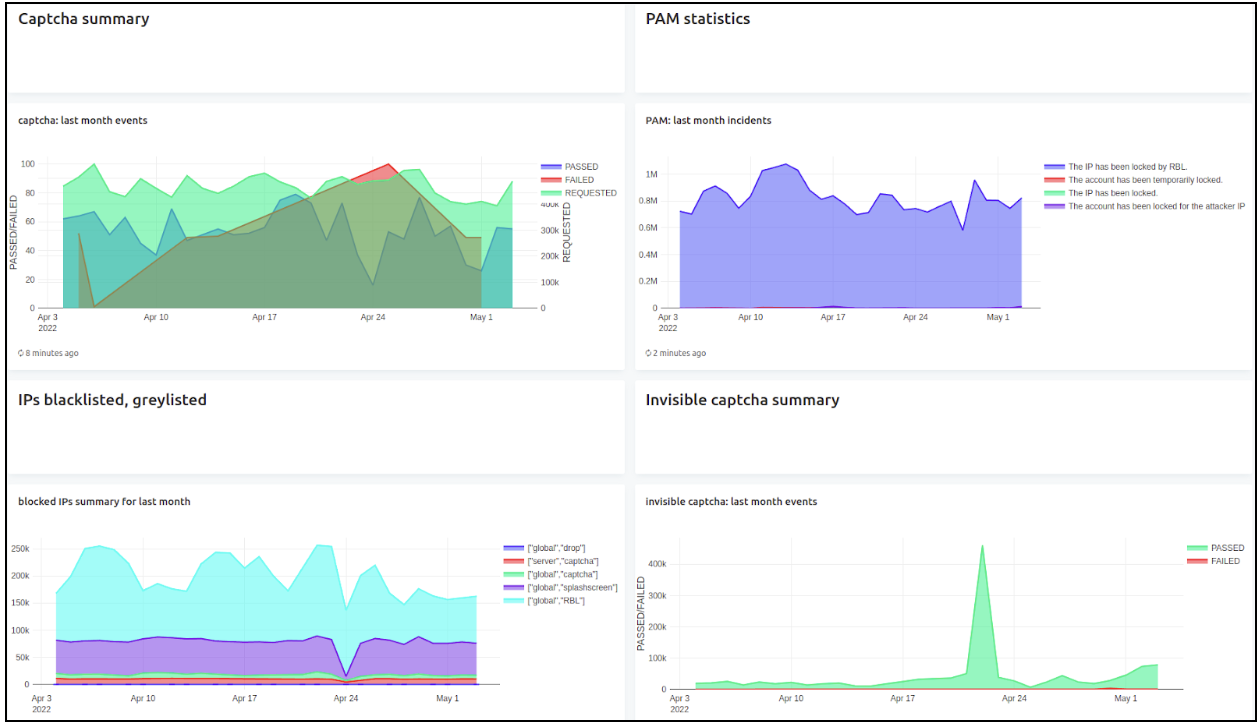
Dashboard PRO also allows you to get a summary of any protection services running inside Imunify360. PAM statistics, captcha summary and more can be found in the predefined set of charts.
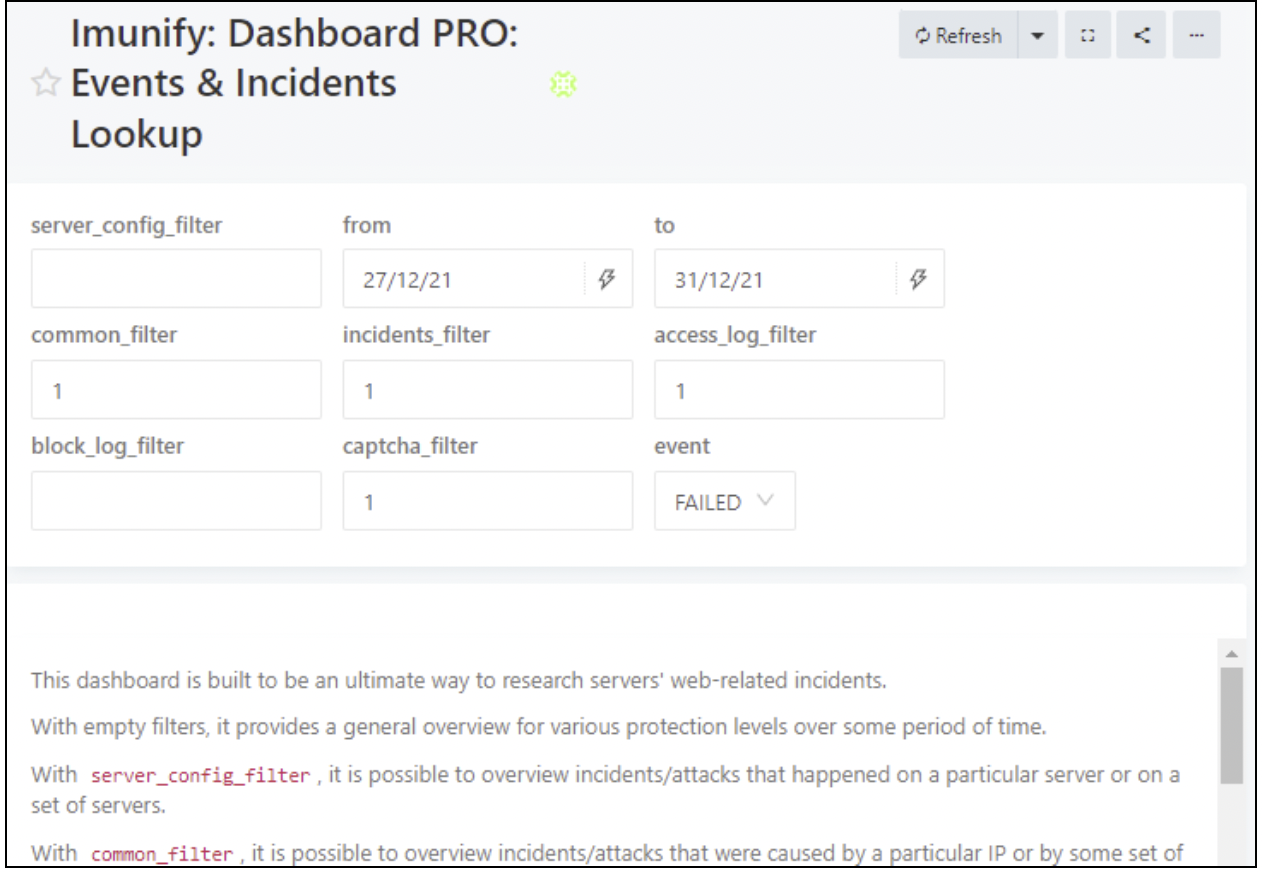
There are also a couple more dashboards included from the start. The Events & Incidents Lookup dashboard examines web-related incidents on a server. Multiple filters can be applied to show specific information about servers, events and attackers.
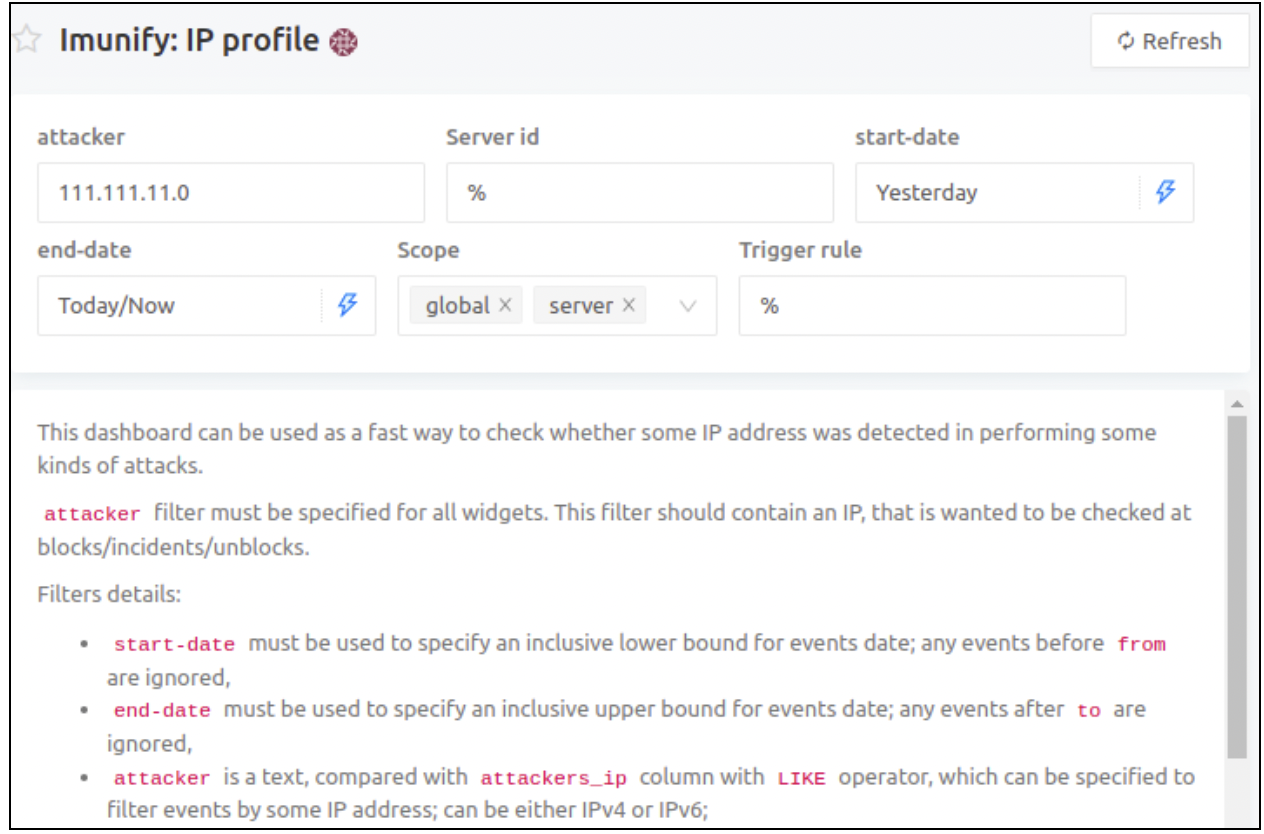
While the IP profile dashboard quickly checks whether a specific IP address was detected in performing any kind of attacks or malicious behavior.
At the moment, we introduce Dashboard PRO in test mode. For now, the solution will only be available to the customers having at least 50 servers in their fleet. To get access to this security solution please create a case with our Imunify support team via the Support Portal.


.png?width=115&height=115&name=pci-dss%20(1).png "pci-dss")